Understanding solar module efficiency alone is not enough
With an almost constant stream of new releases into the PV market, often to great fanfare, it is difficult to put these into a broader context and to easily benchmark and evaluate what is, or is not, market leading.
In this insight we examine the varying efficiency of solar modules. Along with module cost, module efficiency is one of the key metrics often referenced. More efficient modules can deliver savings at a system-level on a cost-per-watt basis – for example on racking, mounting, land and labour.
However, efficiency is not the only factor that needs to be understood to make informed sales or procurement decisions, or when forecasting. Without also understanding other performance parameters (e.g. temperature coefficient), production costs, supply-chain constraints and production capacities, it is very easy to come to the wrong conclusions. Module architecture is also vital to be understood. Variables such as module size, glass thickness and frame design will also influence system design considerations and total installation cost.
Our PV Module Tracker – available through our Solar Technology and Cost (STAC) service, published in partnership with PVEL of the Kiwa group – is a powerful tool that analyses all the relevant performance and architectural parameters of PV modules, enabling users to efficiently benchmark modules on the market today, while also providing context for any new releases.
We have been tracking this data for eight years, and our database – updated quarterly – helps drive our granular PV cost and technology forecasts, enabling us to forecast how these parameters are set to evolve over the medium term.
The sun has set on the mono PERC era

The PV industry is currently in an era of rapid technology improvements. From one quarter to the next we can observe meaningful changes in efficiency distributions of the different module technologies. We forecast that xBC, TOPCon and HJT technologies will all continue to demonstrate efficiency improvements over the next five years, with xBC forecast to outperform TOPCon and HJT.
Unlike these technologies, we do not forecast further efficiency gains for mono PERC, which has been stagnating since 2022, as the efficiency “headroom” for mono PERC has diminished and manufacturers have turned their efforts to other technologies.
The efficiency of a module is important but is not the only metric to consider when evaluating a PV system. Depending on the specific application, temperature coefficient, degradation rate or bifaciality of a module may be more valued – all of which we analyse in our PV Module Tracker.
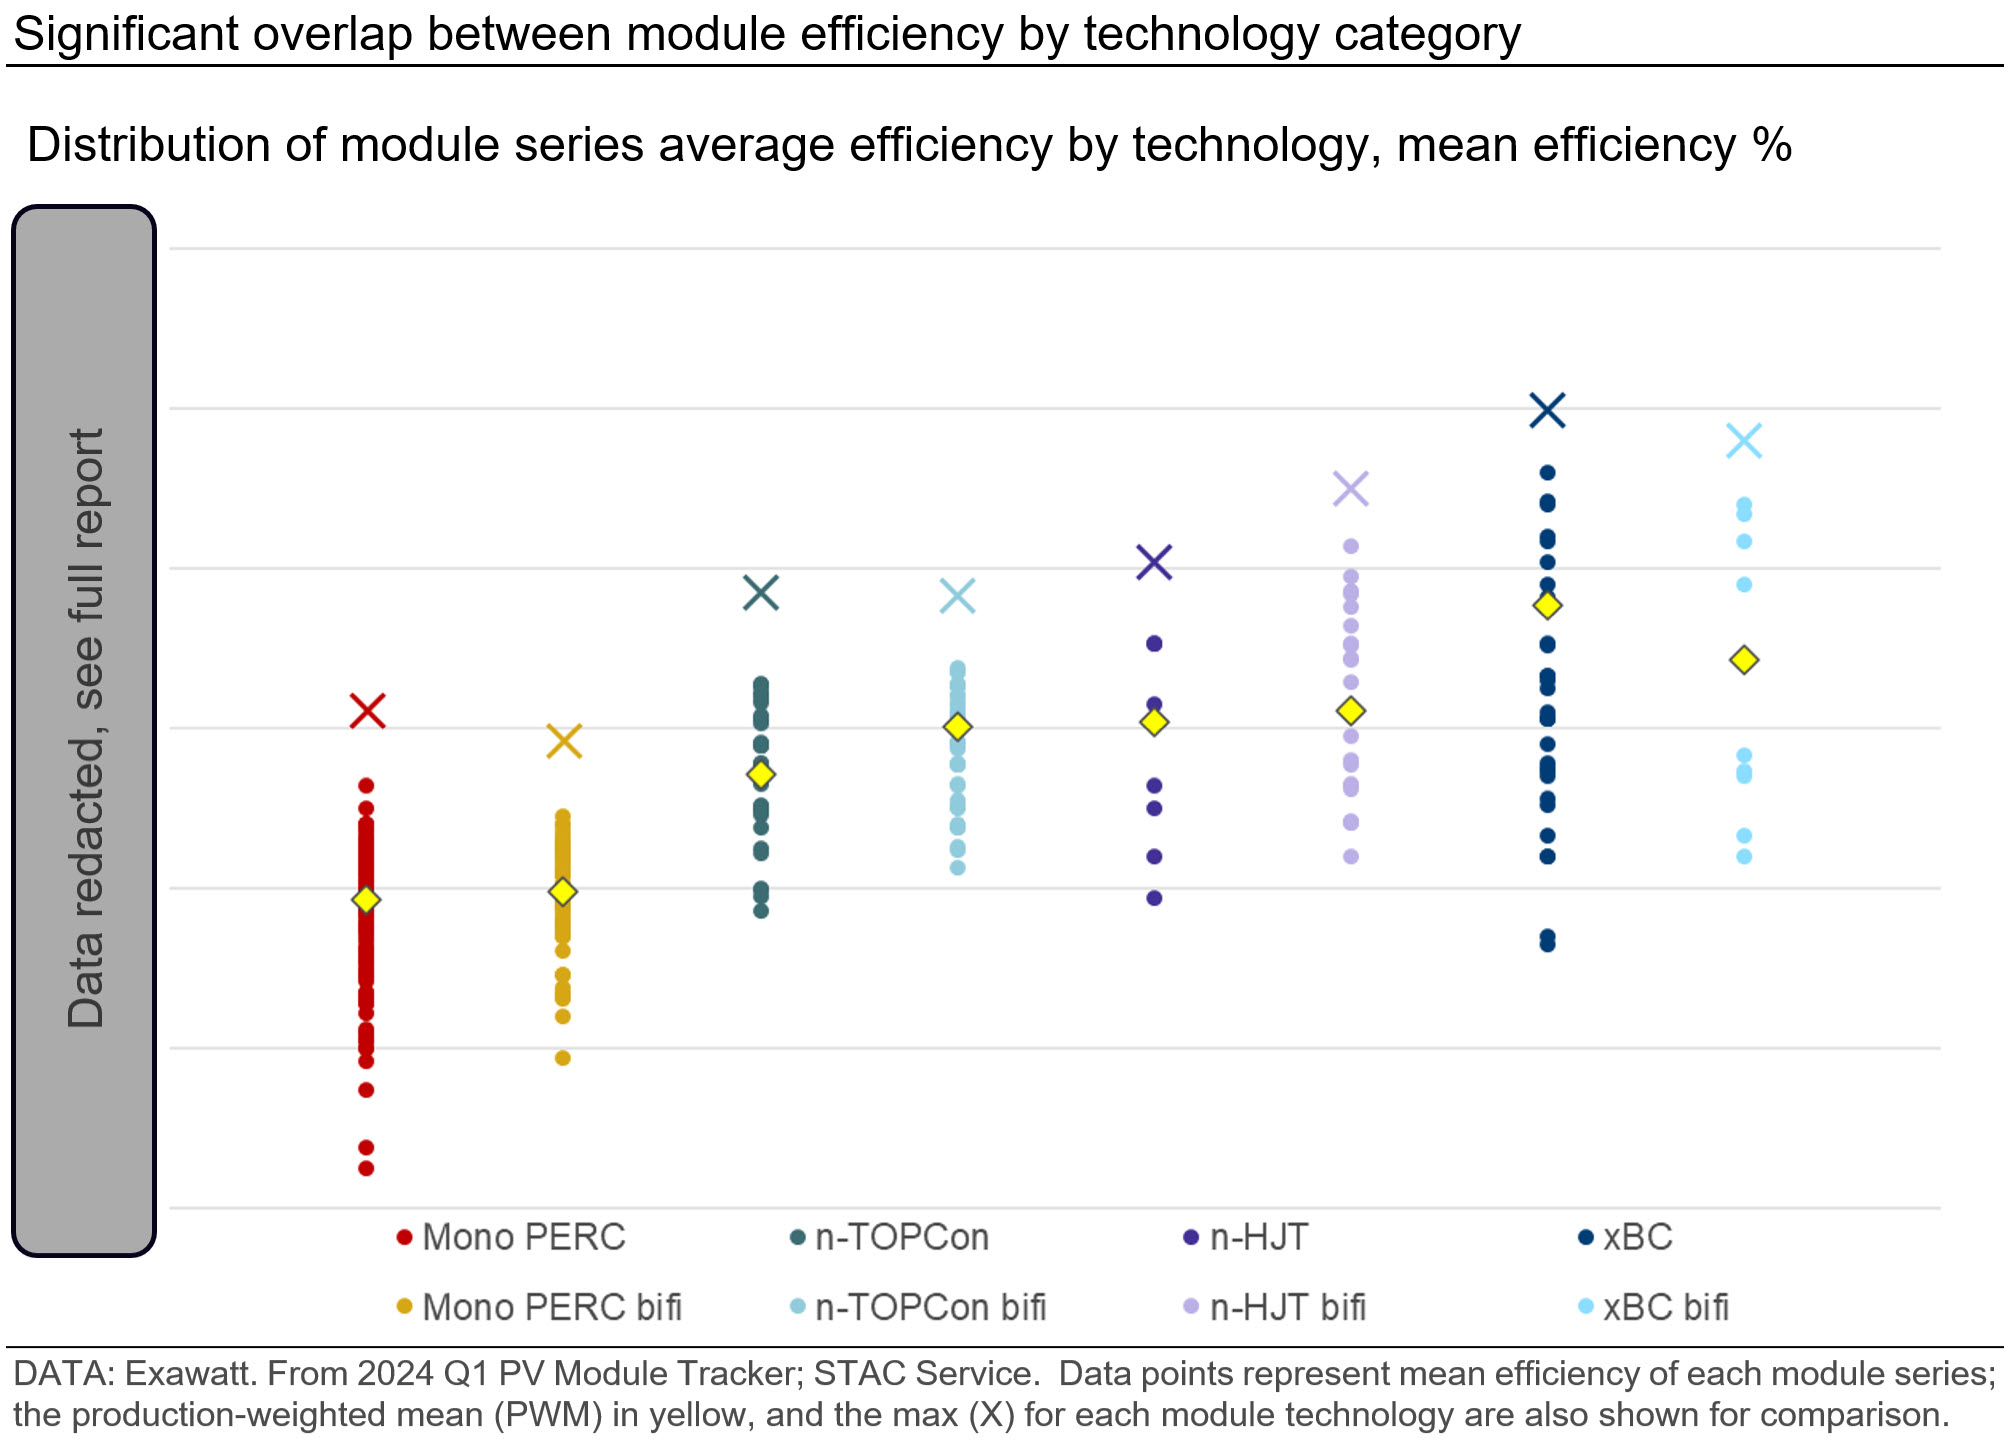
There is no single truth when it comes to module efficiency and technology. There are large efficiency ranges within each technology category which result in significant overlap between technologies, with the highest-efficiency TOPCon and HJT module series outperforming the bulk of the monofacial and bifacial xBC categories.
What will challenge TOPCon?
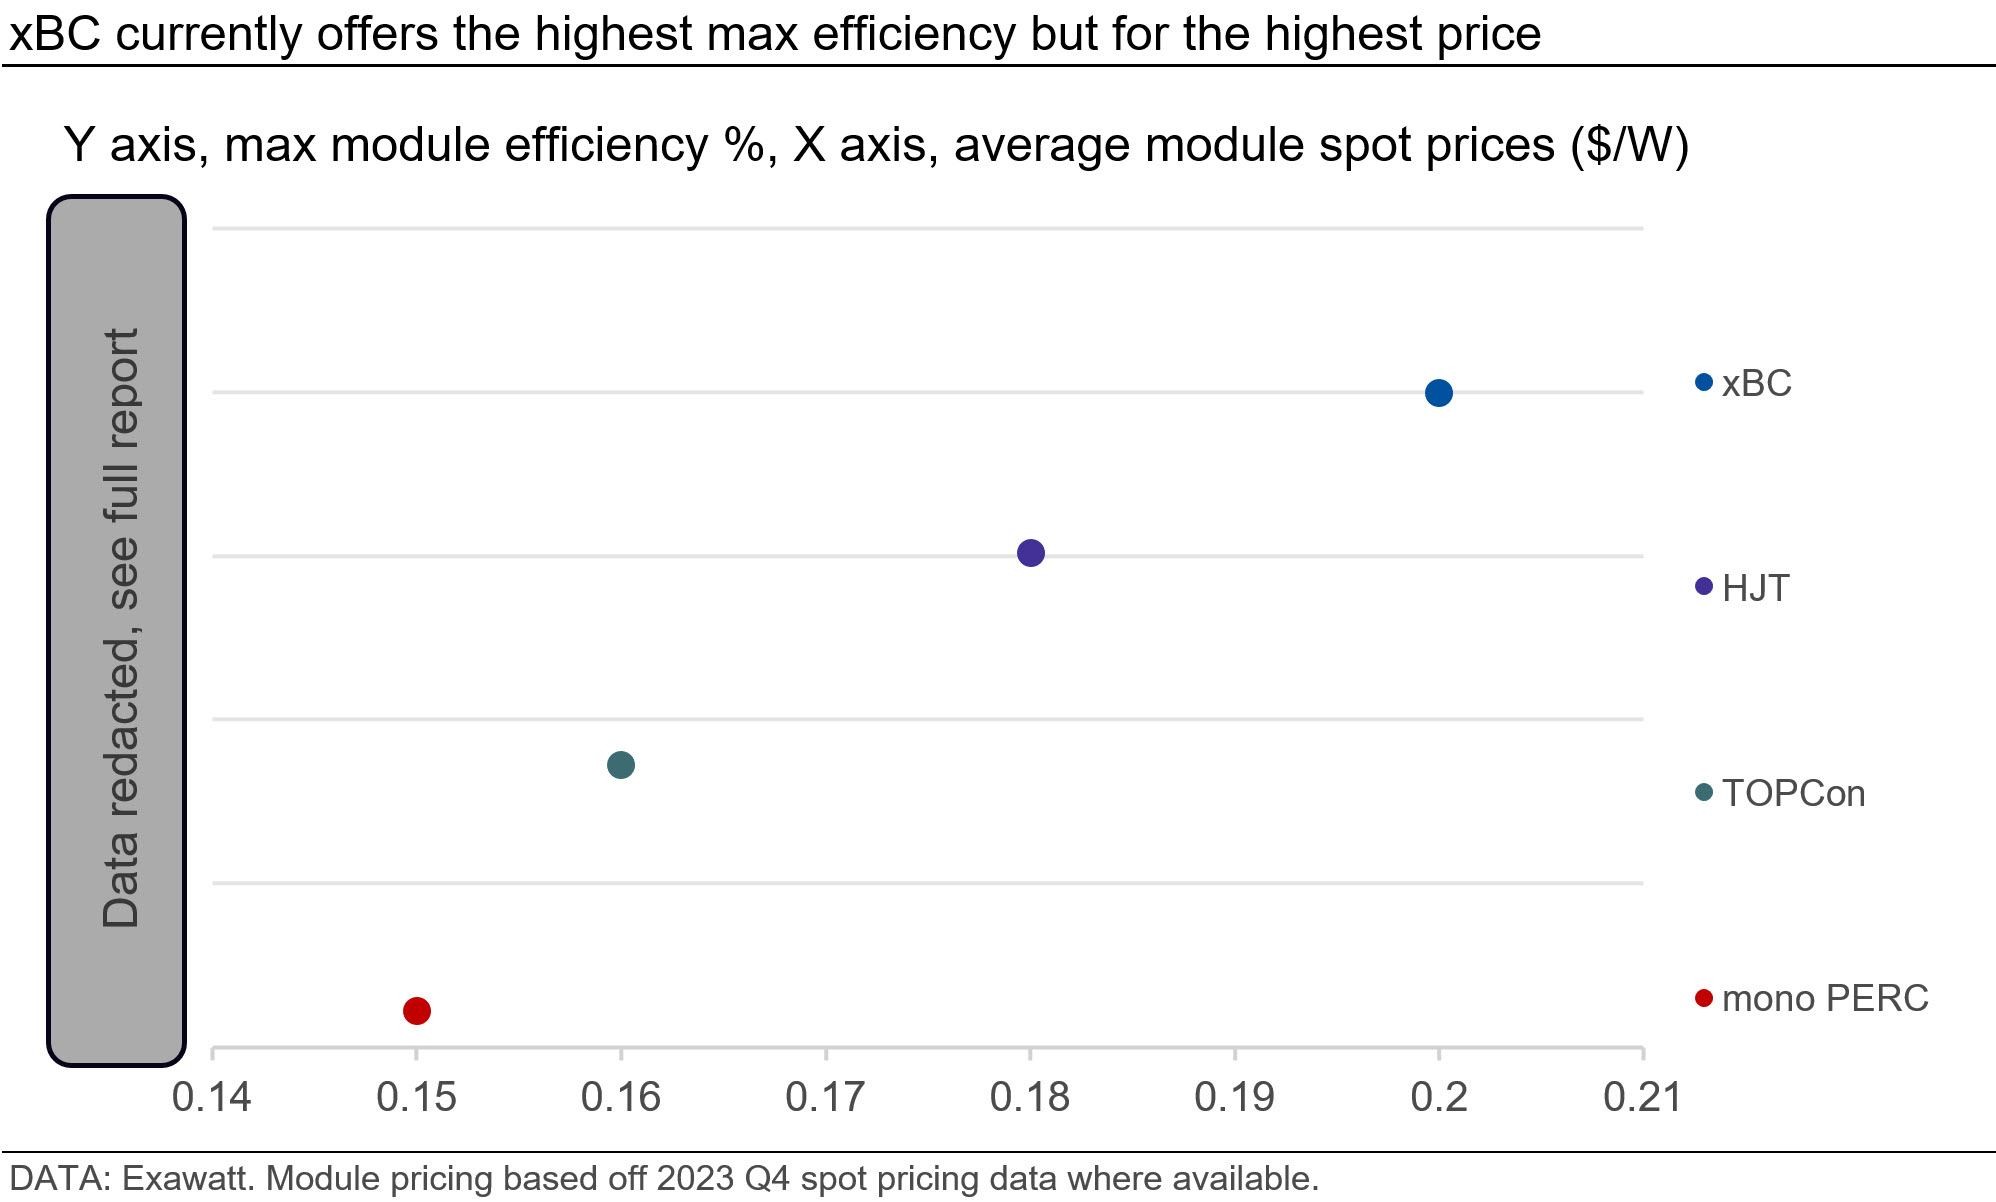
Module performance forecasts cannot simply be made by extrapolating module efficiency historical trends into the future. The full value chain must be considered. In 2024, TOPCon will take over from mono PERC to become the dominant technology in terms of market share, with its high efficiency able to offset its slightly elevated pricing.

As in our most recent 2024 Q1 update, heterojunction (HJT) technology has established a small efficiency lead over TOPCon. However, efficiency is not everything, our modelling suggests that HJT will remain higher cost than TOPCon, even with innovations such as silver-coated copper paste helping to bring down costs.
China remains the dominant manufacturing location for solar technologies. From 2021 onwards, TOPCon cell capacity rapidly increased, and in 2023 it became roughly equal to that of mono PERC. The capacity expansion plans for TOPCon in 2024 and 2025 greatly outstrip those of both HJT and xBC. TOPCon cell capacity is set to exceed 1.2 TW by the end of 2025. This is in part because upgrading mono PERC capacity to TOPCon is far simpler and cheaper than a switch to HJT and xBC.
Theoretical maximum efficiencies for TOPCon are similar to those for HJT, but coming close to realising these limits is reliant on TOPCon manufacturers adopting localised TOPCon passivation at the front contacts of the cell. We view this as a key challenge for manufacturers over the next few years, and while we believe this approach will become mainstream, this is not a given. Should this improvement turn out to be too challenging or too expensive to implement in mass production, then TOPCon’s market dominance is likely to be cut short, with manufacturers gradually migrating towards either HJT or back contact (xBC) technologies.
xBC technologies lead in terms of overall maximum efficiency, pulling away from HJT in recent quarters, with the efficiency delta between the max efficiency of the two technologies increasing from 0.47% (abs.) in 2023 Q1 to 1.14% in 2024 Q1 – data from the 2024 Q1 STAC service.
Despite xBC’s superior efficiencies, we forecast the proportion of the monofacial and bifacial xBC modules on the market will remain small. Space-constrained applications with high non-module costs are the focus for high efficiency (but high cost) technologies, where the efficiency gains are worth more.
Through the mid-term, with xBC unlikely to achieve cost-parity with that of TOPCon, xBC will remain for niche but high value applications, targeted at residential systems rather than larger industrial systems. To gain more market share, xBC will need to see process improvement alongside a high efficiency delta. However, interest in xBC is growing with both LONGi and Aiko Solar ramping capacity at new back-contact cell manufacturing facilities – a trend we will track closely (note that full market and manufacturing forecasts can be found in our Solar Technology and Cost service).
Larger modules – where will module growth end?
In addition to understanding module efficiencies, other performance metrics (e.g. temperature coefficients or degradation) and market factors (e.g. production costs or capacities), market participants also need to consider module architecture which dictates racking and tracker specifications.
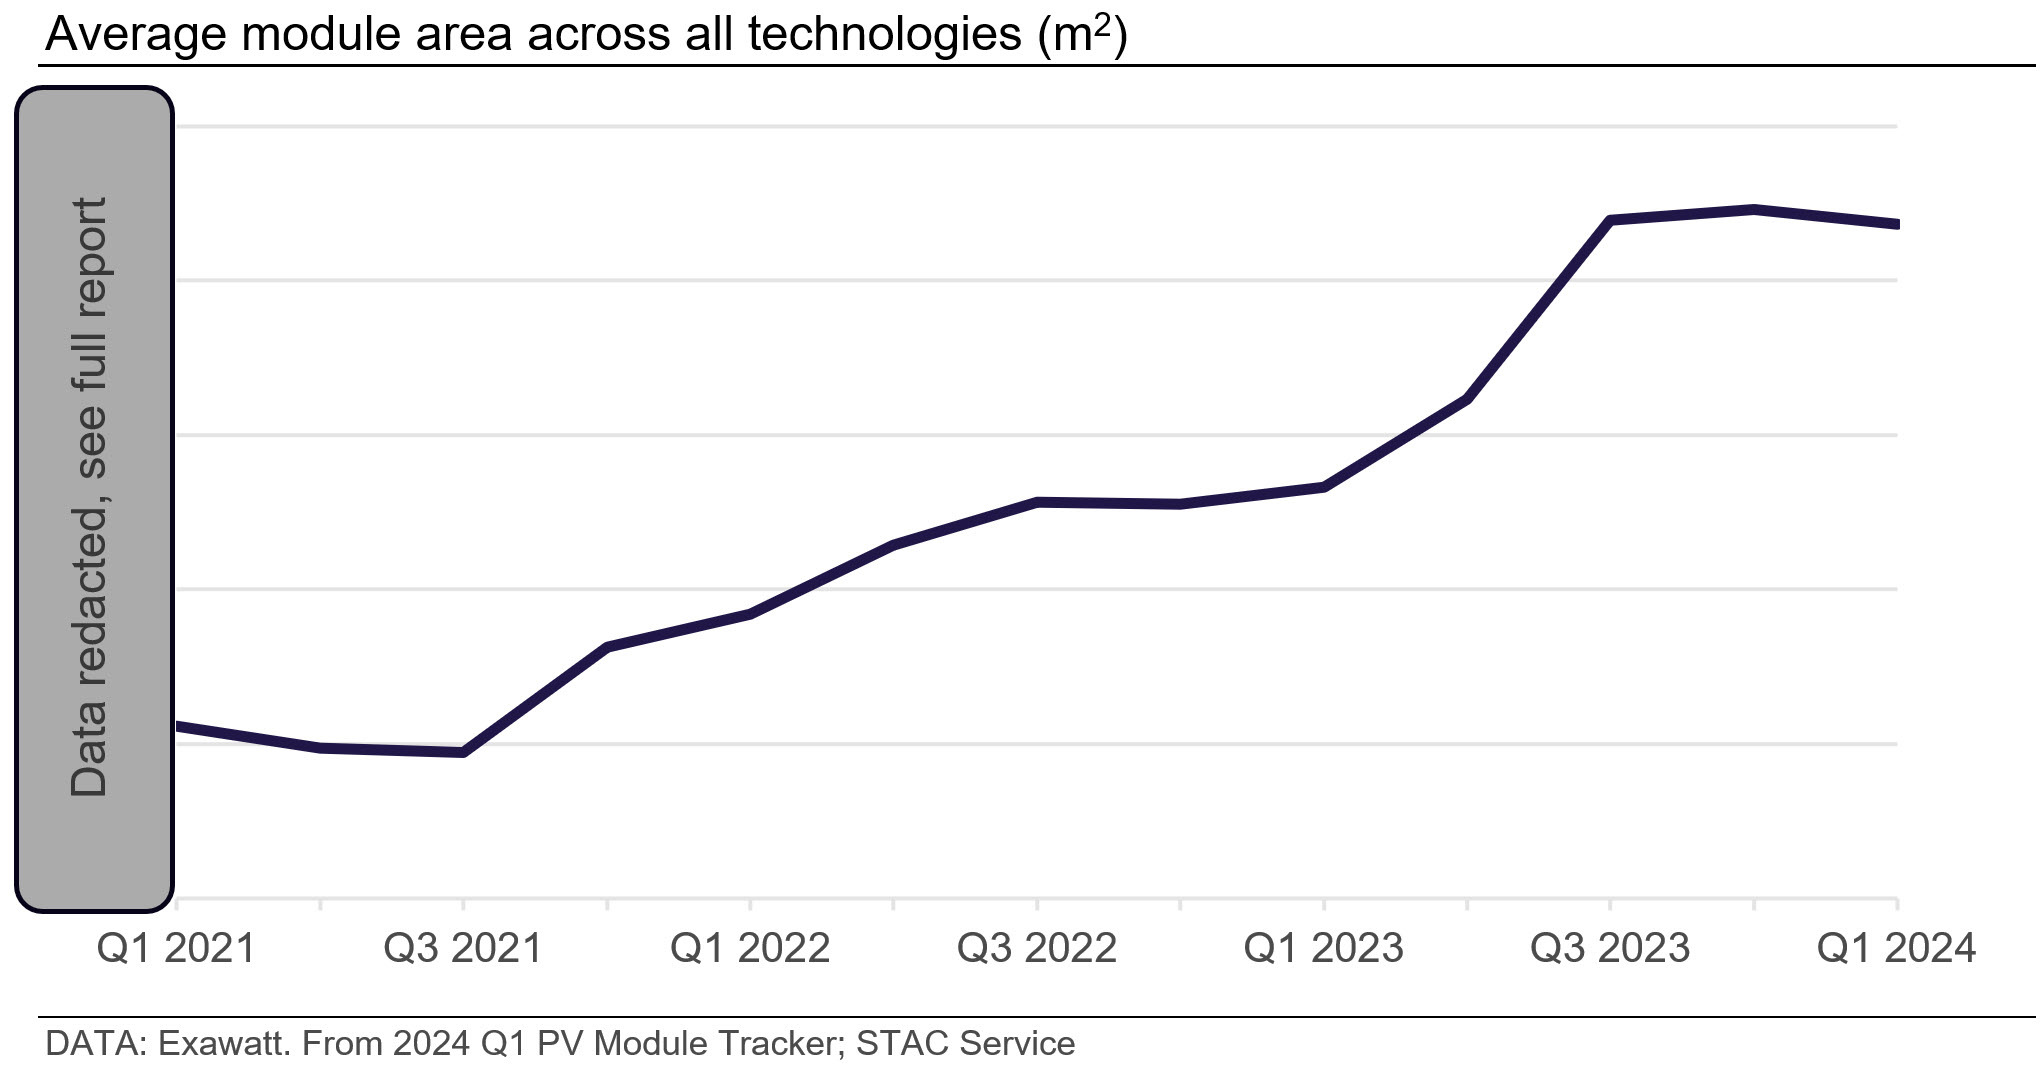
In recent years, average module area has increased in parallel with the transition to larger wafer sizes. Currently modules using an M10 wafer size (182 x 182 mm) dominate our dataset and we do not expect average module area to significantly change in the future.

Nonetheless, we forecast that we will see some changes in wafer choices and expect the proportion of modules using rectangular wafers will grow. We expect wafers with one side length of 182 mm to continue to dominate, though this may include a variety of specifications including 182 x 182 mm, 182 x 210 mm, and 182 x 191.6 mm. Therefore, despite module area not being forecast to increase significantly further, there will be more subtle fluctuations as manufacturers opt for different rectangular wafer dimensions.
Understanding technological change in solar markets has never been more important
Keeping informed about changes and improvements in module performance and design is an extremely important, but extremely time-consuming task. Tracking, then understanding, all these metrics across the constantly changing product offerings is difficult. Yet the costs for failing to do so can be huge.
Understanding the solar market requires consideration of the overall system. Therefore, understanding efficiency alone is not enough. Wider module performance and architecture metrics need to be considered in combination and in the context of production costs and capacities. Looking simply at one variable in isolation, such as efficiencies, leads to erroneous forecasts and can result in expensive choices.
Explore this topic with CRU


