
Author Jorn de Linde
Senior Vice President View profileUnprecedented price volatility during 2021 H2
Silicon prices are shaped by changes in demand, the resulting supply response, and the underlying production cost structure. Last year’s dramatic run-up in silicon prices can principally be attributed to market fundamentals. The supply side struggled to keep pace following a sharp rebound in global silicon demand in late 2020. The upward pressure on silicon prices intensified during 2021 Q3 when it appeared that large-scale curtailments in Chinese output would be implemented through the remainder of the year. At the time, there were also concerns that a serious drought could trigger electricity rationing and significant cutbacks in Brazilian silicon production.
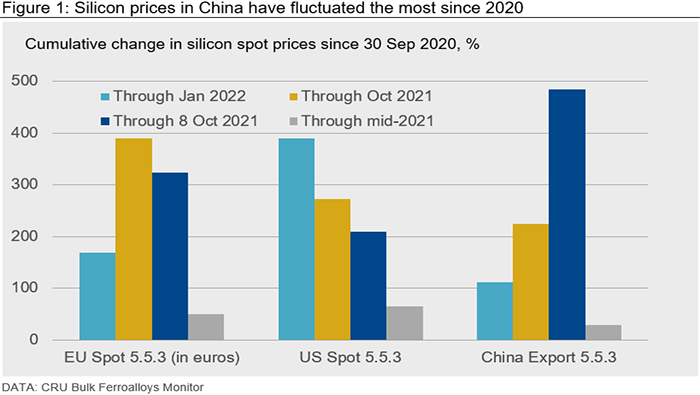
After posting gains that ranged from ~28% in China to nearly 65% in the USA between the end of 2020 Q3 and mid-2021, silicon spot prices climbed rapidly during the latter half of 2021 Q3 into the early part of Q4. This escalation reflected growing apprehension over announced Chinese production controls and the implications for global silicon supply.
The anticipated large cutbacks in production never materialised. As output restrictions were gradually lifted, the initial run-up in Chinese silicon prices supported near record-high, local production during 2021 Q4, swiftly bringing spot prices for Chinese material back to the levels that prevailed in late August. Except in the USA, spot prices in the other major silicon markets also declined substantially under the impact of slowing demand and rising supply.
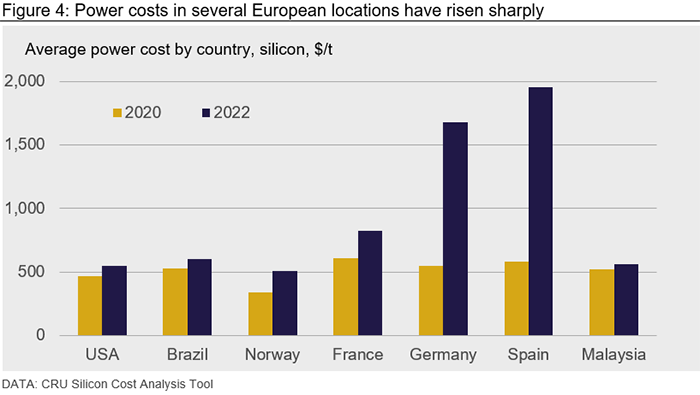
Power-related production costs have increased substantially more in Germany, Spain, and Bosnia than they have in France or elsewhere in Europe, i.e., Iceland and Norway. These variations can mainly be attributed to differences in power supply arrangements, and the resulting effect of soaring market-based electricity prices on the rates paid by individual silicon smelters. The following chart shows the projected power costs in select countries in 2022 compared with 2020.
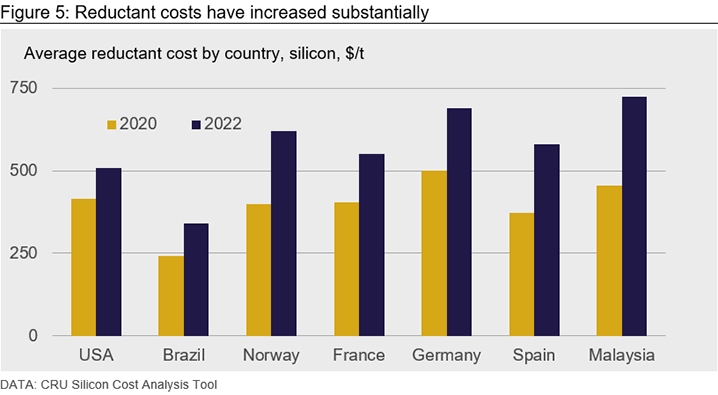
Reductant and electrode costs have also increased substantially. Again, the impact has differed significantly between countries, partly due to logistics. Notably, Brazilian silicon producers benefit from access to captive supplies of charcoal and the resulting cost advantage has been magnified by a weak currency.
The jump in prices coincided with an escalation of costs
Although the 2021 H2 surge in silicon prices reflected market forces, it happened at a time when the upward pressure on production costs was intensifying. After a two-year lull, power rates had started to increase in most locations, and raw materials and electrode costs were climbing, compounded by rising transportation costs, especially for seaborne freight. Moreover, a closer link between silicon prices and power rates has emerged in China, extending to provinces where electricity generation is predominantly based on coal – notably Inner Mongolia. By paying higher rates, silicon plants were able to remain in production and take advantage of the spike in silicon prices.
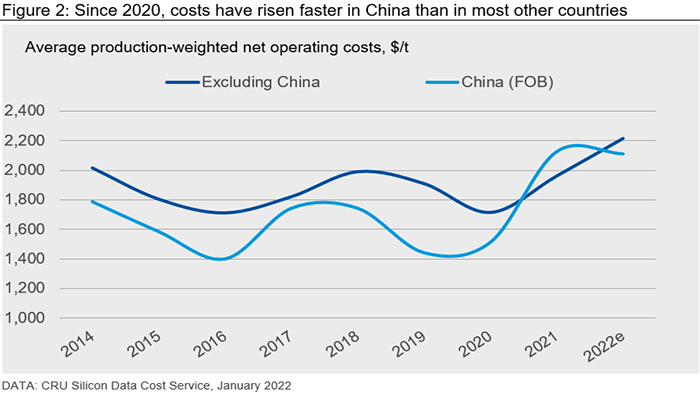
The downward correction that occurred in late 2021/ early 2022 has brought local spot prices much closer to the levels needed to sustain operations at higher-cost silicon plants in Europe and China. Consequently, production costs will play a more prominent role in shaping the near-term path of silicon prices in these markets. The compression of profit margins also implies that spot prices in Europe and Asia are likely close to a bottom. Additional declines would likely trigger cutbacks in local production, in turn keeping prices from falling even more.
The rise in silicon production costs has been far from even
The escalation in silicon production costs to some extent reflects broader-based inflationary pressures, amplified by lingering supply chain disruptions. However, recent increases in power, raw materials, electrode prices, and transportation costs have typically far exceeded corresponding broader-based measures of inflation.
Largely due to soaring local electricity rates, silicon plants in continental Europe have been the most impacted by these cost pressures – as illustrated by the chart below (with European silicon plants marked in blue). Spot electricity prices in Europe fell substantially during the early stage of the Covid-19 pandemic but have since risen sharply. This escalation can, in large part, be attributed to soaring coal and natural gas prices. The rise in fuel costs has been compounded by higher CO2 prices and a combination of other factors – including a rebound in electricity demand, low wind speeds, and below average precipitation levels.
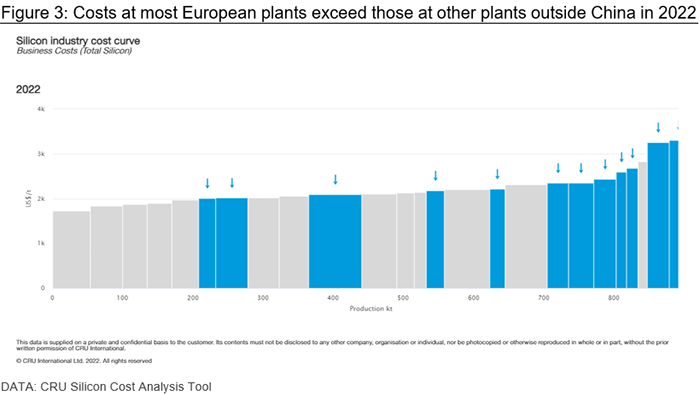
Power-related production costs have increased substantially more in Germany, Spain, and Bosnia than they have in France or elsewhere in Europe, i.e., Iceland and Norway. These variations can mainly be attributed to differences in power supply arrangements, and the resulting effect of soaring market-based electricity prices on the rates paid by individual silicon smelters. The following chart shows the projected power costs in select countries in 2022 compared with 2020.
Reductant and electrode costs have also increased substantially. Again, the impact has differed significantly between countries, partly due to logistics. Notably, Brazilian silicon producers benefit from access to captive supplies of charcoal and the resulting cost advantage has been magnified by a weak currency.
The upward pressure on costs is expected to abate as supply side disruptions gradually ease. However, increases in silicon production costs will likely continue to exceed more broad-based measures of inflation beyond mid-decade. The rise in costs will be compounded by a gradual weakening of the US dollar. As a result, silicon prices are projected to stay substantially higher than they were in the years prior to the Covid-19 pandemic.
Assessing silicon market and costs in an environment marked by rapid changes
If developments over the past several years offer any guide, producers, consumers, and other stakeholders in the silicon market and industry will be operating in an environment characterised by heightened uncertainties and substantial volatility. To learn more about the silicon-related services offered by CRU or to arrange for a demonstration of our recently launched silicon cost analysis tool (CAT) please get in touch.
Explore this content with CRU
Author Jorn de Linde
Senior Vice President View profile