The synchronised rise in commodity prices in 2021 prompted some market commentators to speculate the beginnings of a “supercycle”.
At CRU, we are more cautious. In the past year, commodity prices have been more volatile than in the preceding years, with most commodities ending 2021 with higher prices than they started with, many significantly so.
Explore this topic with CRU
CRU expects 2022 will be a more moderate year for commodity prices. Lower price volatility and smaller price gains are expected for some commodities while for others, where we believe the price cycle has peaked, we expect to see prices decline.
In June 2021, we wrote “Beware the bubble”, which outlined the short-term factors we saw drawing all commodity prices higher. Each commodity value chain has its own specific subtleties which explain price gains, regional price variance and why some prices have already fallen (e.g., iron ore). Overall, 2021 was a year of record price rises and price volatility and has proved to be a good year for many miners’ and commodity producers’ margins. These margins allowed companies to pay down debt, invest in much needed new supply, invest in the green energy transition, or return capital to shareholders.
2021 Commodity Price Heat Chart measures a record year
We entered 2021 with prices rising fast from 2020 Q4, and with the global economy emerging from the summer hiatus and its various Covid-19-induced lockdowns. As restocking and government stimulus fuelled demand on the one side, supply chain issues continued to disrupt supply on the other, resulting in market tightness and commodity price rises not seen for a decade.
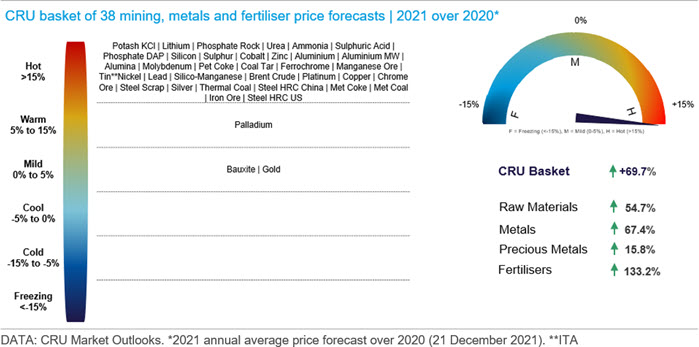
CRU’s Commodity Heat Chart tracks the annual average prices for a basket of 38 commodity price benchmarks across sectors grouped into raw materials (bulks), industrial metals, precious metals, and fertilisers. Considered as a snapshot of year-on-year price change, the Commodity Heat Chart is a bellwether for the commodity sector showing high double-digit growth for commodity prices in 2021. Tracking annual average year-on-year prices for our commodity baskets shows prices rocketing in 2021 H1 from cyclical lows in 2020.
Surprising strength and resilience of the price rally
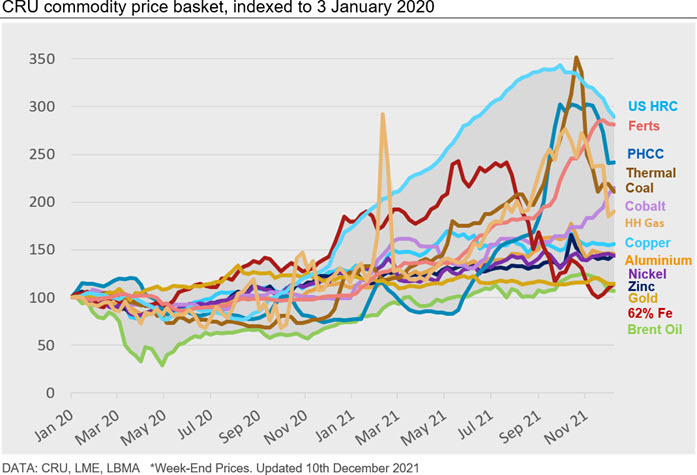
The strong rally in commodity prices that began at the end of 2020 continued into 2021, driven by the tight market balance resulting from restricted raw material supply and strong post-Covid-19 demand. By the start of 2021, production facilities affected by Covid-19 restrictions were still slowly ramping up while the effects of the pandemic on just-in-time supply chains had not been totally resolved. Simultaneously, government investment in post-Covid-19 stimulus packages and removal of lockdown restrictions created robust demand for commodities as global economies re-opened.
High commodity prices remained for longer than expected in 2021, supported by certain strong market fundamentals. Increased emphasis on the metal-intensive ‘green energy transition’ combined with booming EV production figures supported the prices of metals required for battery production, electrical components and electrification. Furthermore, continued disruption to supply chains, protectionist export restrictions and rising gas and power costs all threatened production, supporting high commodity prices.
The commodity price rally intensified in 2021
With strong demand prices have risen faster than costs
A universal commodity price rally in 2021 H1 created excellent margins for miners but raised production costs for producers of finished metal and fertiliser products - generally tightening margins. Margins for producers were by no means consistent and varied significantly by region. While the price of raw materials rose globally, specific regional supply issues created regional scarcity of key raw materials and inputs. The threat to supply posed by supply chain issues inflated prices in these regions, creating wide regional price spreads.
The rising price of raw materials and key inputs, such as power, translated into higher production costs for producers of finished metals and fertilisers. These producers maintained margins by raising the price of their products, made feasible due to strong post-Covid-19 demand in end-use markets. The extent of price increases was much greater in regions with supply issues, where producers could greatly increase prices, improving margins and creating wide regional price spreads.
One of the most notable examples of regional price inflation was in the North American steel market, where high prices spurred by supply concerns and increasing lead times resulted in US steel producers operating at margins greater than 40% for 2021 Q3. Import from other regions into those with high margins was hampered in the second half of 2021 through the implementation of protectionist export restrictions, particularly in Russia and China, with the aim of protecting domestic producers.
Business costs for producers of energy-intensive commodities, such as zinc and aluminium, and nitrogen-based fertilisers increased alongside rapidly rising natural gas prices. For the most part, the effects of increased production costs in 2021 were absorbed by raising the prices of finished products, which continued to be purchased due to strong post-Covid-19 demand. Where demand failed, a downward correction for the price of that commodity quickly followed. This was exemplified by the historic downward price correction for iron ore, caused by declining Chinese steel demand due to the expected enforcement of emission quotas and the slowdown in the Chinese construction sector.
Outlook for 2022
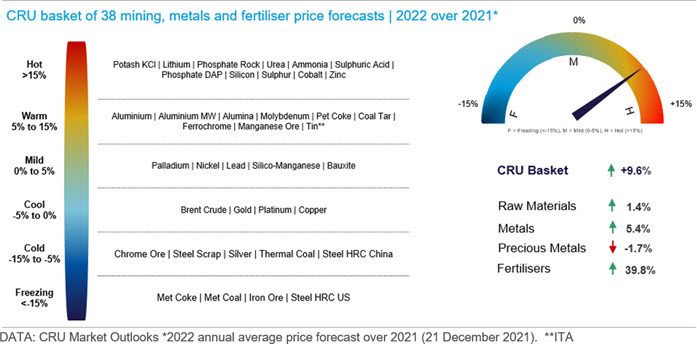
Looking ahead to 2022, we expect the CRU Commodity Basket to increase again but by a more moderate margin compared to 2021, at 9.6%. Commodities such as Lithium and Cobalt will show strong year-on-year growth as they benefit from increased battery-related demand. In contrast, we expect iron ore prices to average much lower in 2022 as the market will be less undersupplied due to reduced Chinese demand, high inventories and improved global supply.
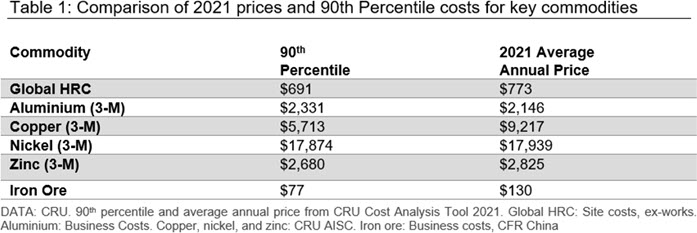
CRU will be paying particularly close attention to demand side factors in 2022. With prices high, elevated far above the 90th percentile on the cost curve, margins are stretched. This cost relationship creates a situation where decreases in demand will be quickly followed by falling commodity prices, in a similar way to iron ore in 2021 H2.
Explore this topic with CRU

