
Author Paul Butterworth
Research Manager View profile
Author Shankhadeep Mukherjee
Senior Analyst and Team Leader View profile
First, the acquisition of ArcelorMittal steel assets in the USA by Cleveland-Cliffs, then the bid for Thyssenkrupp Steel by Liberty Group, for which talks have since ended, and the now discontinued interest of SSAB in TSE IJmuiden.
While Tata Steel continues with the process of looking for investors in their European assets, ArcelorMittal is also reportedly looking to expand their operations in the developing world and they have recently entered the Indian market with the acquisition of the assets of erstwhile Essar Steel.
In fact, our analysis of the ArcelorMittal and Cleveland-Cliffs transaction reveals that the sale was quite beneficial for ArcelorMittal in reducing their exposure to low margin assets. In this Insight, we demonstrate how data from CRU’s Steel Cost Model and CRU’s Steel Market Outlooks can be used for this type of analysis as well as expand the same to forecast future performance of other regional businesses of the group.
ArcelorMittal profitability varies widely by region
In 2019, ArcelorMittal (AM), operating out of 18 countries across the world, produced 90 Mt of steel. At that time, the company had 16 steel making facilities in Europe, six in North America, five in Brazil and two in Africa. Most of the production of the group is via the BOF route (i.e. nearly 80% of steel produced in 2019). The remaining production is via the EAF and Conarc routes, though Saldanha Bay, the sole site with a Conarc facility in the group, has been mothballed since 2020 Q2.
Not all locations have the same level of profitability, which can vary widely, however, each follows general industry trends. Company reported data suggest that the Brazilian operations are the most profitable, generating an EBITDA of ~$105 /t over the last five years, whereas the South African operations are the least profitable, generating an EBITDA loss of -$0.4 /t during the same period. Below, USMCA refers to assets across USA, Mexico and Canada.
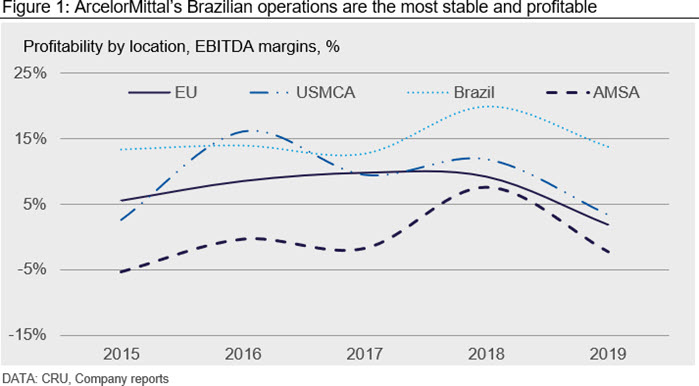
While the profitability of ArcelorMittal USMCA assets has not been high, we will demonstrate that, with the sale of their USA assets to Cleveland-Cliffs, the profitability of the remaining USMCA assets is expected to improve.
Within USMCA region the USA assets are low margin
The total enterprise value of AM’s USA assets included in the Cleveland-Cliffs acquisition was $3.3 bn, which we understand from announcements is six times the annualised EBITDA over the period 2017–2019. Thus, we can calculate the annualised EBITDA of these assets over the same period to be ~$550 M.
While AM does not report the results for the USA operations separately, we can use CRU’s Steel Cost Model (n.b. subscribers can access here) and CRU’s Steel Market Outlooks to estimate the revenues of the plants sold to Cleveland-Cliffs – the cost model includes data on the sales portfolio by mill and the market outlooks include finished steel prices, in each case both historical and forecasted. We also rely on annual reports for revenues from Calvert that has remained with AM’s North American operations.
We can estimate the share of the USMCA revenue from the USA plants included in the Cleveland-Cliffs purchase to be 58% of the total (n.b. excluding revenues from Calvert the share will be 70%), which implies annualised revenues from these assets of ~$11.0 bn (2017–2019). Based on an annualised EBITDA of $550 M as given above, this implies an annualised EBITDA margin for these assets of ~5% during this period. Equally, this implies a profitability for the USMCA assets excluded from the purchase (e.g. AM Mexico, AM Dofasco and Calvert) of ~14%. Thus, the sale was quite beneficial for AM in reducing their exposure to low margin assets.
Having said that, we should recognise that the 2017–2019 period was a strong period for the steel industry globally, with profitability above steady state. In addition, US mills further benefited from higher prices following the imposition of S232 tariffs early in the period. As such, we believe that steady-state profitability will be lower than the figures quoted here (see below).
Steady-state profitability of the US asset base compares with that of the South African assets
We can expand the above analysis to all the operations of AM and calculate the steady-state profitability of the assets of the company across the globe. For this we again use CRU’s Steel Cost Model and market outlooks. CRU’s Steel Cost Model contains information on raw materials, other inputs, country macroeconomic data, equipment capacities, technology, operating efficiencies, logistics costs and many other cost data needed to generate accurate costs estimates.
Based on the sales portfolio of each mill, we can calculate a weighted average cost of production on an annual basis and, also using the sales portfolio, but combined with prices from our market outlooks, we can calculate a weighted average sales prices for each mill. We provide monthly updates of prices to subscribers of our market outlooks.
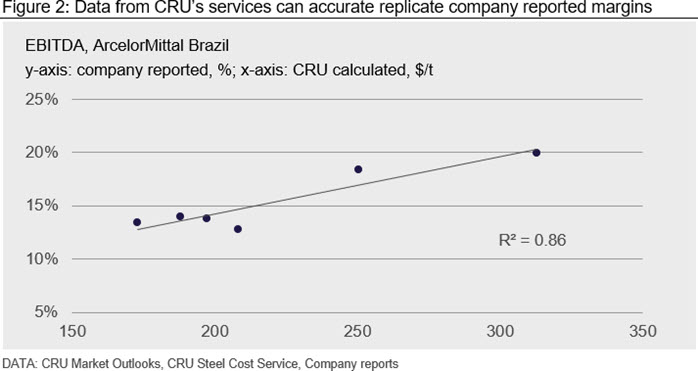
Our analysis shows that the delta between the calculated weighted average cost of operations and the weighted average sales price, or ‘notional’ margin, correlates very well with company reported EBITDA margins historically. In Figure 2, we show this correlation for AM’s Brazilian operations, which is highly statistically significant. Similar levels of correlation are witnessed across Europe, North America and Africa.
We can use this historical comparison to arrive at the long-term, steady-state or through-cycle performance of the respective locations of AM and these are shown in Figure 3. AM Brazil has the highest steady-state EBITDA margin of all locations, at 13.4%. At the other end of the spectrum lie the South African assets with a steady-state profitability of 3.3% for the longs division and 1.2% for the flats division.
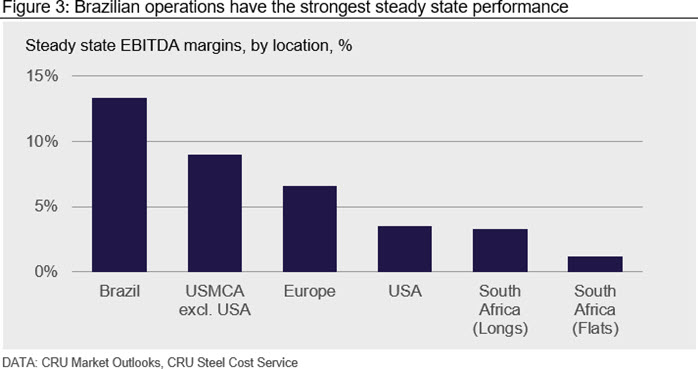
For the North America region, we have further split out the steady-state profitability into USA and USMCA excl. USA assets. We arrive at these values by taking the ratio between the steady-state profitability and average EBITDA margins of the USMCA assets over the 2017–2019 period and multiply that by the margins calculated for USA and USMCA excl. USA respectively during that period.
Unsurprisingly, while the steady-state performance of North America is at 5.8%, much of that appears to have been supported by the Canada and Mexico assets whose steady-state profitability is calculated at ~9%. At ~3–4%, the estimated steady-state profitability of the US assets included in the Cleveland-Cliffs purchase is comparable to AM’s South African longs operations, which is amongst the lowest in the Group.
AM South Africa flats division profitability expected to improve
AM mothballed their Saldanha Bay operations in South Africa during 2020 Q2. However, a draft of the South African government’s Steel Industry Master plan for South Africa proposes a restart of the plant after separating from the AM Group. This would not be the first time AM has divested a unit in Africa – AM exited their operations in Algeria almost five years ago by transferring their stake in the Annaba plant to the government. Thus, while it is too early to say if something similar will happen in South Africa, the actions of AM to divest of their least profitable assets in North America perhaps suggests the South African assets may also be a consideration in this regard.
We have established above that our cost and market outlook services together can be used to accurately model the historical performance of a company, the same method can also be followed to forecast the future profitability of an asset. As both our cost models and market outlooks provide forecasts for the next five years (to 2025), using the forecasted cost of production and outlook of sales prices, we can calculate company profitability over the medium term.
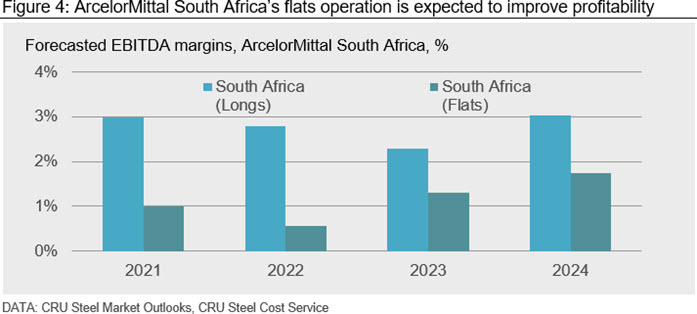
The above chart represents the forecast EBITDA margins for AM South Africa. The longs division is expected to maintain its higher profitability over the flats division during this period and will average ~3%. However, with the closing of Saldanha Bay in 2020, the profitability of the flats division is also expected to nearly double from 1% in 2021, to 1.8% in 2024. Having said that, neither operation is expected to earn minimum sustainable levels of profitability that we would put closer to 7–9% EBITDA.
CRU’s services can support company valuation and M&A
The past few months have witnessed a flurry of M&A activity involving large steel producers and indications are that M&A activities are likely to continue as steelmakers look to either enter emerging markets or deleverage their balance sheets. Whatever the case, with CRU’s global coverage of the steel supply chain from steel production costs to finished steel prices, we are well placed to help in estimating steady-state profitability, near-term profitability and valuation of any asset.
Explore this topic with CRU
Author Paul Butterworth
Research Manager View profile
Author Shankhadeep Mukherjee
Senior Analyst and Team Leader View profile